Architecture Overview
DashPad implements a clean microservices architecture with two distinct components designed for different deployment scenarios.
System Design
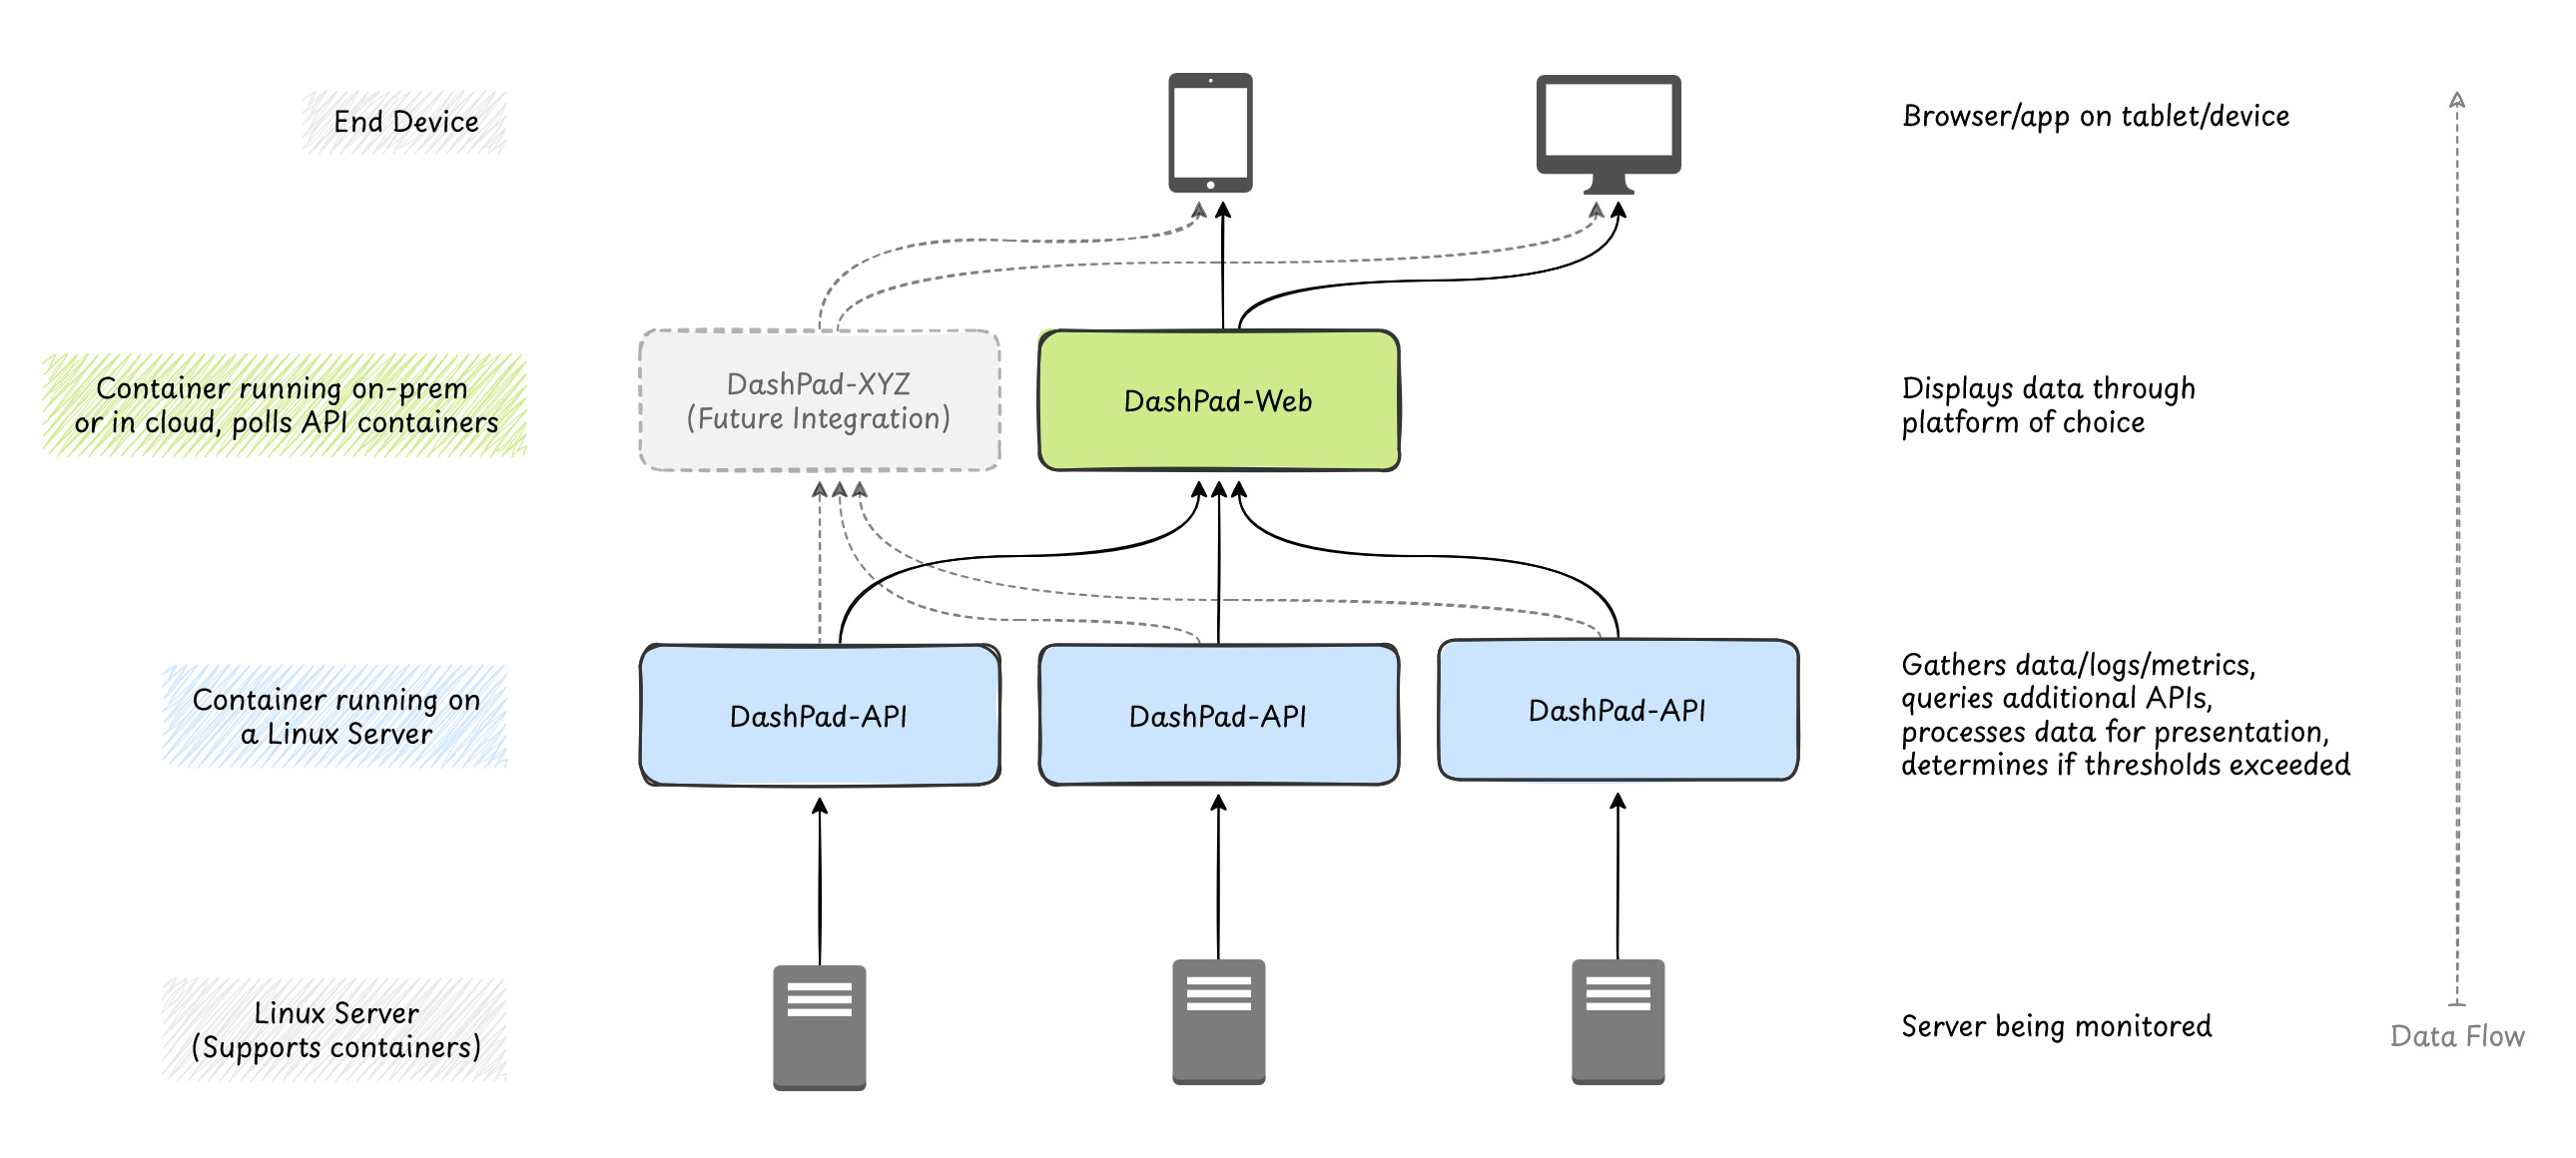
DashPad uses a two-container architecture:
- DashPad-API: Runs on the (Linux-based) server being monitored, collects system metrics
- DashPad-Web: Can run anywhere, displays the collected metrics
The API container MUST run directly on the Linux server because it needs direct access to system files like /proc, /sys, and log files. The Web container connects to one or more API containers to display data.
DashPad-API Architecture
Technology Stack: FastAPI, Python 3.9+
Key Responsibilities:
- System metrics collection from multiple sources
- Data caching for efficiency
- RESTful API endpoints
- Modular metric collection system
Resource Usage: ~50MB RAM
The API uses a modular architecture where each metric type (CPU, RAM, etc.) is a separate module with its own collection logic.
DashPad-Web Architecture
Technology Stack: Svelte 5, NGINX
Key Responsibilities:
- Responsive tablet-optimized interface
- Real-time data visualization
- Local settings management via localStorage
- Multi-server dashboard coordination
Resource Usage: ~20MB RAM
The Web interface polls the API at regular intervals and displays the data using a unified module system.
Data Flow
- Metric Collection: API reads system data from sources (direct file reading or Netdata API)
- Data Processing: Raw data is processed and status is evaluated against thresholds
- Caching: Processed data is cached to reduce system load
- API Response: Data is formatted and returned via RESTful endpoints
- Frontend Polling: Web interface requests data at configured intervals
- Display Update: UI updates with new data and visual status indicators
Data Sources
The API supports multiple data sources with automatic fallback:
- Direct: Reads directly from
/proc,/sys, and log files - Netdata: Queries the Netdata API if available
Multi-Server Architecture
DashPad supports monitoring multiple servers from a single Web interface.
Each server runs its own API container, and one central Web container connects to all of them.
Design Principles
Separation of Concerns
Backend Controls:
- WHAT data is collected
- Collection intervals and sources
- Alert thresholds and business logic
- System configuration and access
Frontend Controls:
- HOW data is displayed
- Dashboard layout and positioning
- UI preferences and behavior
- Which servers to monitor
This separation ensures the API remains authoritative for data while the frontend handles presentation, making the system flexible and maintainable.