DashPad
NOTE: As of August 11th, this documentation is still a work in progress. Many pages are frequently updated and will continue to change until official release. Thank you for your patience! -Chris
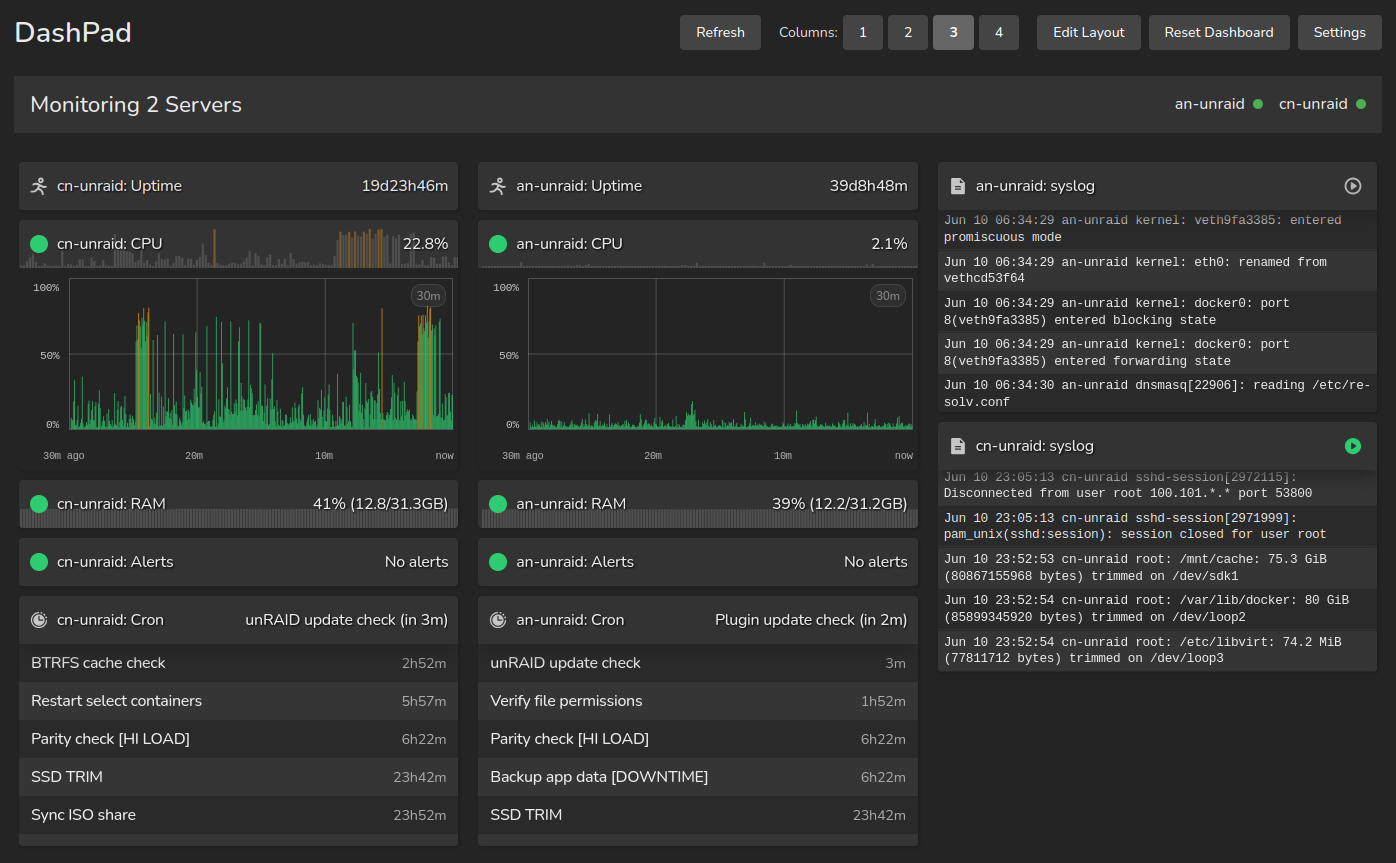
A modular system monitoring solution designed to repurpose old tablets as dedicated system metrics displays.
Or, if you prefer something with a bit more flair:
Don't let your old iPad or tablet become superannuated (what a word!)—repurpose it with DashPad!
PROJECT STATUS
DashPad is currently in active, pre-release development. Since the project is created and managed by a solo developer, the primary goal is to establish a stable and coherent codebase that aligns with long-term architectural goals.
Consequently, pull requests will not be reviewed or accepted at this time. The codebase is likely to undergo significant changes, and this documentation should also be considered a living document. Your interest and patience as the project matures is appreciated!
What is DashPad?
DashPad transforms old, unused tablets (namely iPads) into real-time system monitoring displays for your servers. Built with a microservices architecture, it provides comprehensive infrastructure monitoring with minimal resource usage.
DashPad traces its origins to 2024 as a basic, single-container solution to monitor unRAID server metrics in near-real-time. The project saw major development in mid-2025 where it was used as part of an educational project.
For the curious, you can read the final report here: DashPad Final Report
Key Features
- Real-time Monitoring: Updates every 2-60 seconds (configurable)
- Tablet Optimized: Responsive interface designed for iPad and other tablets
- Multi-Server Support: Monitor multiple systems from one dashboard
- Modular Design: Enable only the metrics you need
- Lightweight: Minimal resource usage on both server and tablet
DashPad-API and DashPad-Web can be used 100% locally without a connection to the Internet.
DashPad is for you if...
✅ You have old tablets gathering dust
✅ You want lightweight system monitoring without a database
✅ You prefer simple, visual monitoring displays
✅ You run home servers or small infrastructure
✅ You value resource efficiency
✅ You want at-a-glance system health visibility
DashPad is NOT for you if...
❌ You need historical data storage (at least, for more than one hour)
❌ You require complex alerting rules
❌ You want a full monitoring stack
❌ You need Windows support
❌ You require user management or multi-tenancy
❌ You need to monitor multiple dozens of servers
❌ You're uncomfortable leaving electronics on and plugged in constantly
Architecture Overview
DashPad consists of two primary microservices:
| Component | Description | Deployment |
|---|---|---|
| DashPad-API | Backend data collection service | Local server only |
| DashPad-Web | Frontend monitoring interface | Local or cloud |
IMPORTANT
The API container (DashPad-API) must run directly on the server being monitored, as it requires access to system directories like /proc. Only the Web container can be deployed to the cloud.
Available Metrics
- System Metrics: CPU usage, RAM usage, system uptime
- Log Monitoring: Real-time system log viewing
- Scheduled Tasks: Cron job monitoring
- Alerts: Netdata integration for system alerts
Documentation
- Architecture - Technical design overview
- API Configuration - Backend setup
- Web Configuration - Frontend setup
- API Reference - Endpoint documentation
Support
- Documentation: You're here! 👋
- Source Code: GitHub Repository